
This website uses cookies so that we can offer you the best possible user experience. The cookie information is stored in your browser and performs functions such as recognizing you when you return to our website or helping our team to understand which sections of the website you find most interesting and useful.

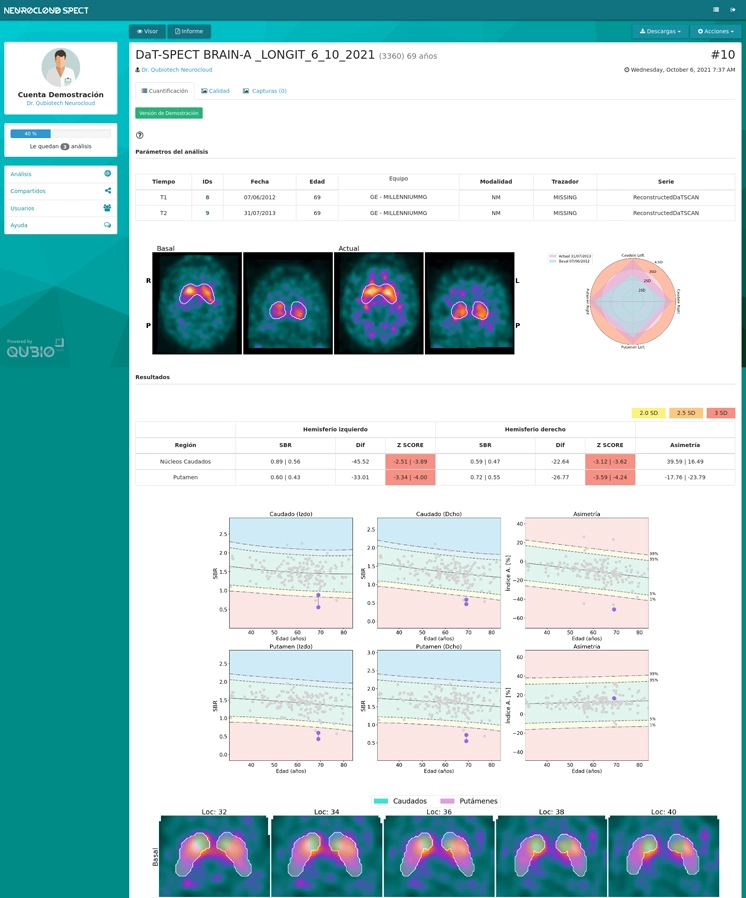
Quantitative DaT-SPECT image analysis (123I-ioflupane / FP-CIT) for the diagnosis and monitoring of Parkinson’s disease.
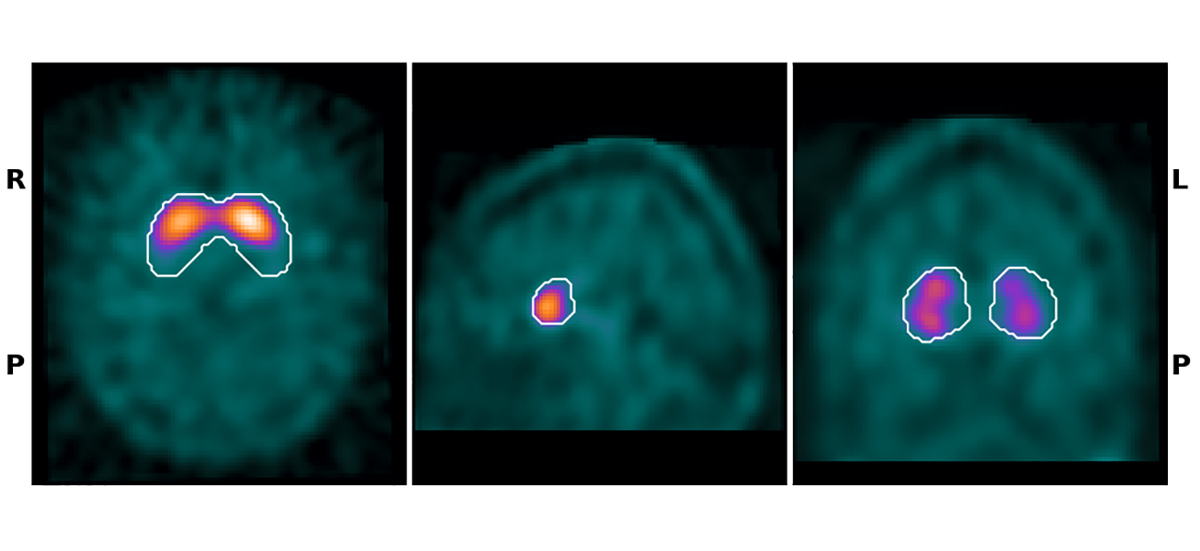
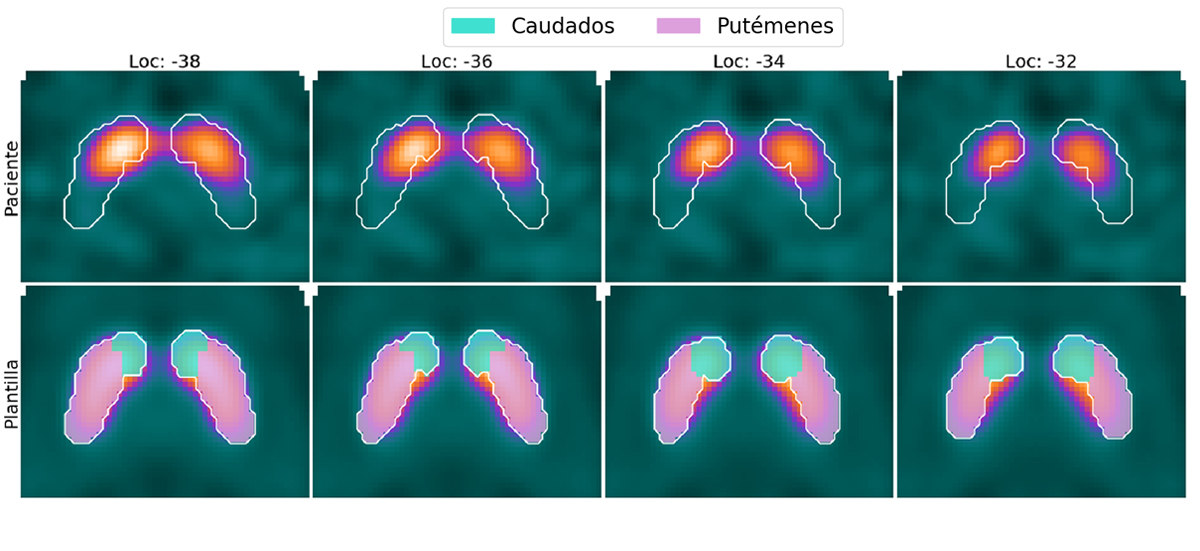
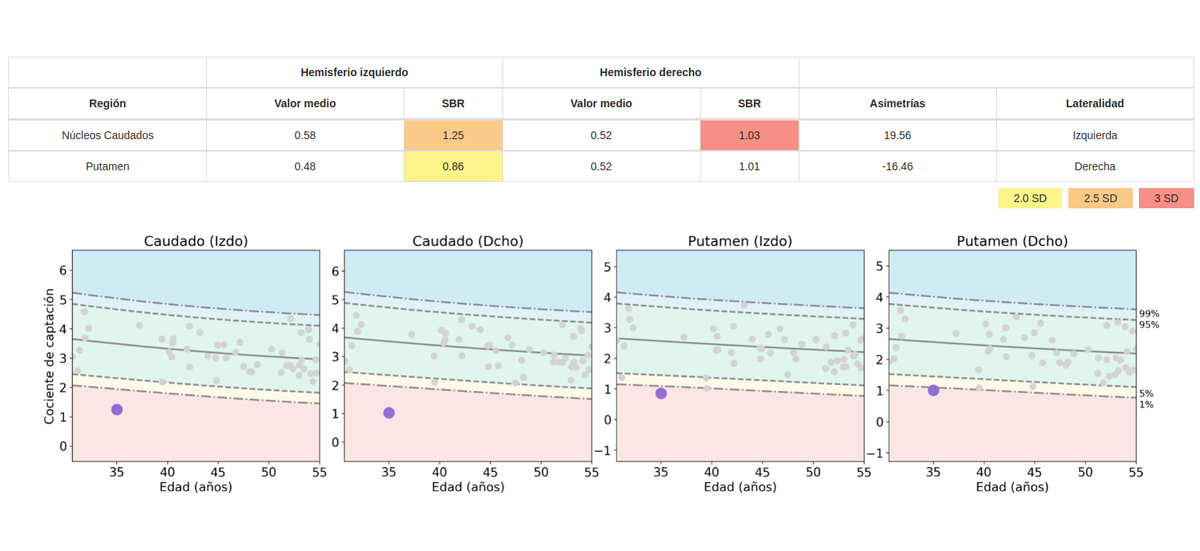
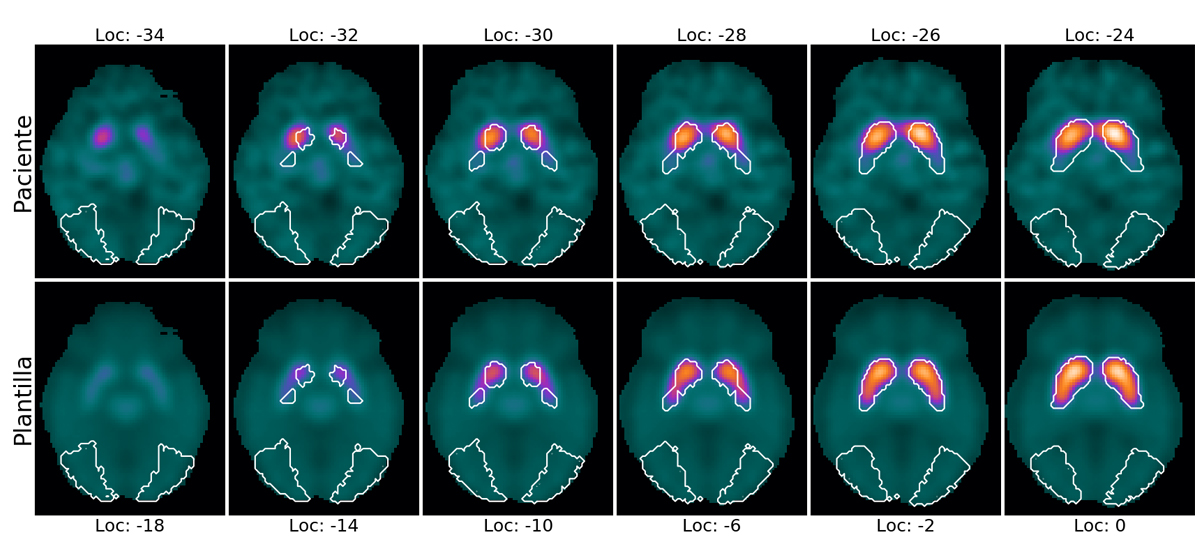
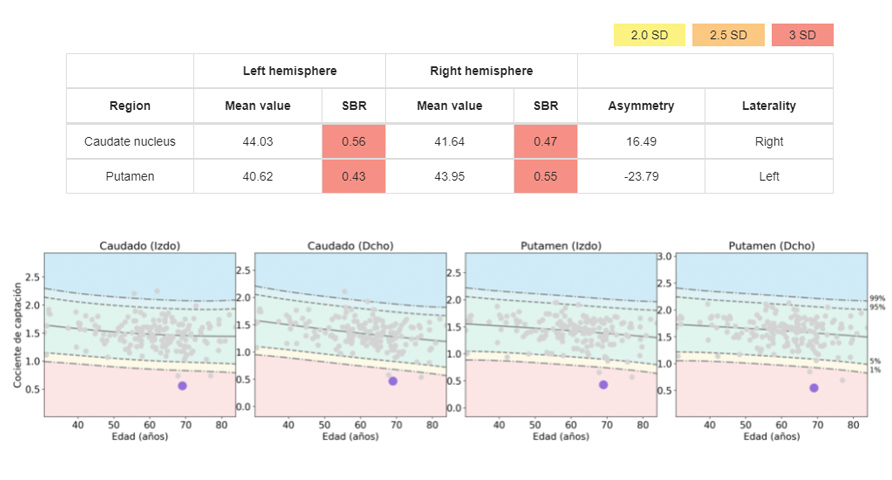
Our software provides uptake values in the dopamine receptors of the caudates and putumes by calculating the SBR ratio with respect to a non-specific region located in the occipital area, together with the asymmetry index between cerebral hemispheres.
Patient measured values are compared to an age-stratified database of healthy controls based on imaging studies published under the PPMI (Parkinson’s Progression Markers Initiative) project. ).
As a result of the analysis with Neurocloud-SPECT, you will obtain a results report with visual and quantitative information that you can easily share with your collaborators.
Help in nuclear medicine
Automatic measurement of the DaT catchment by calculating the SBR indicator and the asymmetry indices in caudates and putumes. Assessment of the results by comparing analysis with a database of healthy subjects. Longitudinal study that facilitates patient follow-up.
Help in neurology
Visual and quantitative information structured in an easily configurable report for quick interpretation of the results. It complements the qualitative evaluation of the images with reliable data.
Help in diagnosis
Sensitive
Detect the loss of dopamine receptors through the quantitative and comparative analysis of your DaT-SPECT images
Independent of the observer
Quantitative analysis eliminates inter-specialist variability for a more robust assessment of imaging findings
Specific
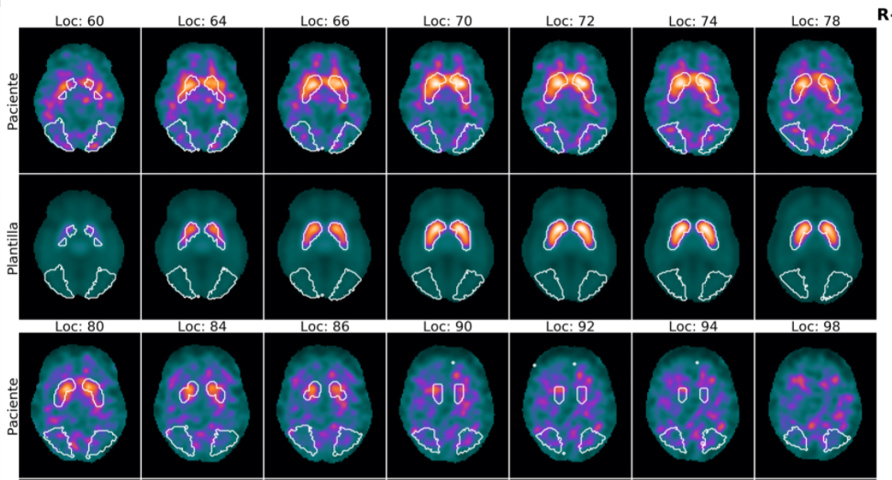
All the necessary resources for the diagnosis in a single tool that allows interactive 3D visualization of DaT-SPECT images and the generation of customizable reports integrating numerical and visual information.
Automatic
Automatic processing and obtaining results in less than 5 minutes.
Connectivity with PACS systems
for seamless integration with your workflow.

100% Compatible with your equipment and PACS

Fast, intuitive and fully automated

Invisible integration in clinical practice

Continuous and free updates

Continuous and personalized assistance

Hiring adapted to your needs

Clinically validated, CE marked
